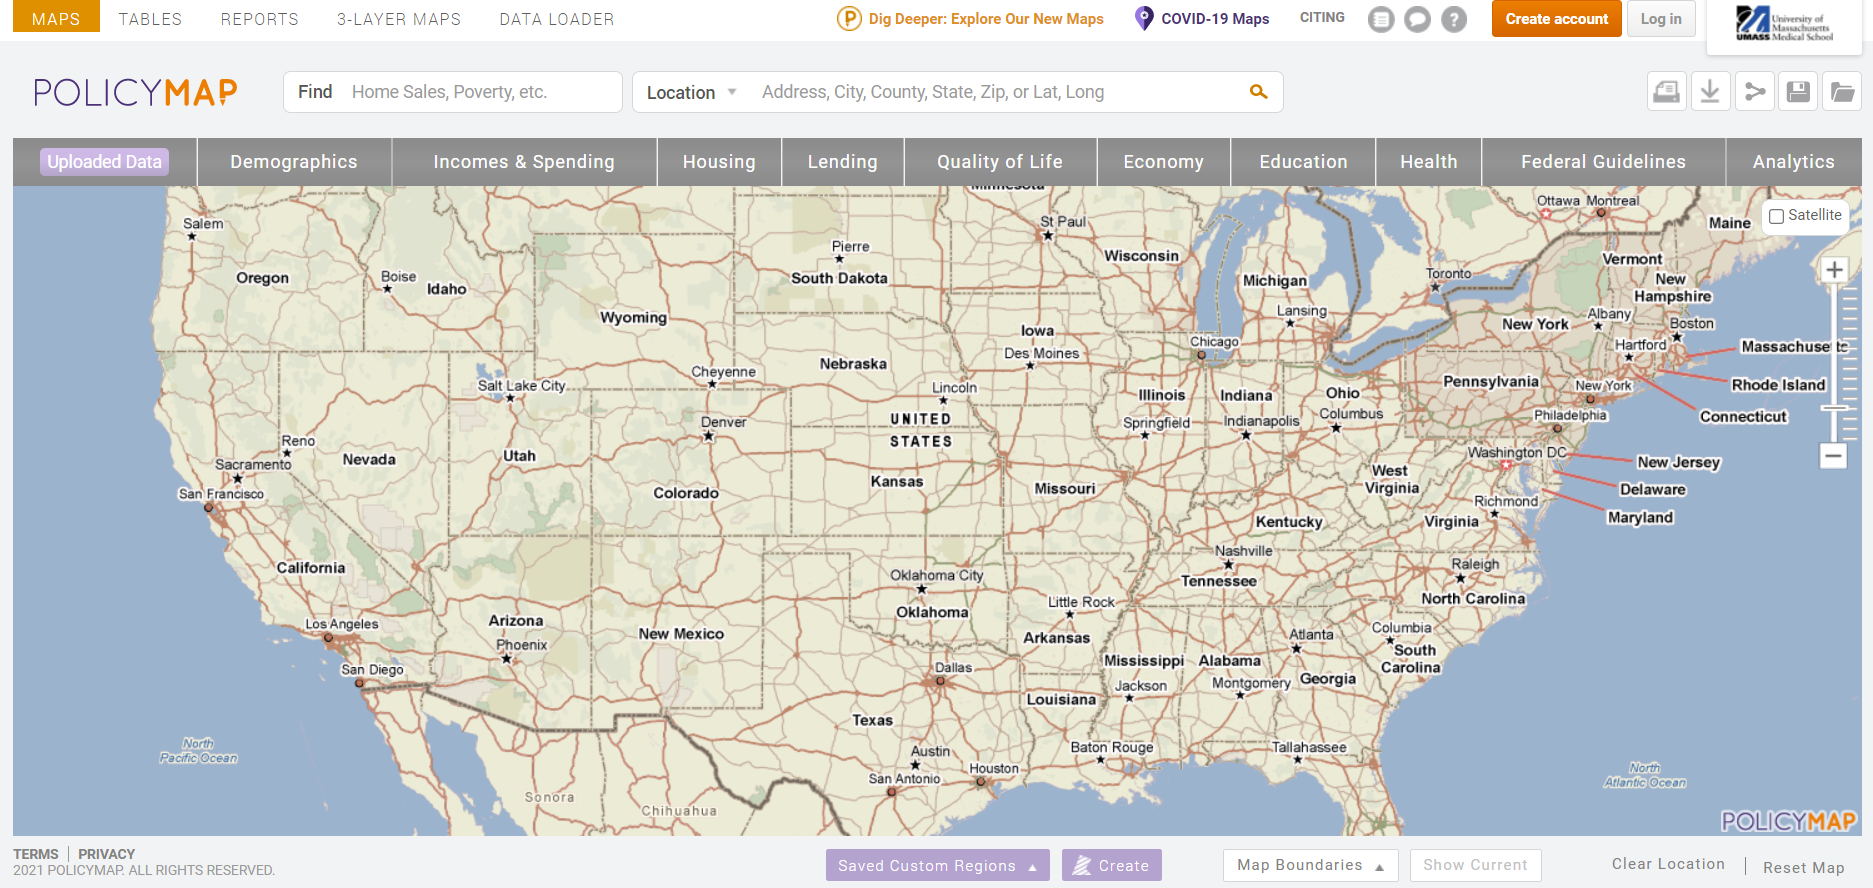
Get To Know: PolicyMap
Are you interested in knowing which areas of Worcester have the highest rates of hypertension? Or what areas in Central Massachusetts have known environmental contamination? How about visualizing Covid-19 vaccination rates by average income levels in local neighborhoods? We have a resource for that!
PolicyMap offers easy-to-use online mapping with data on demographics, real estate, health, jobs, and more in communities across the US. With PolicyMap you are able to visualize information down to the neighborhood level, making this an invaluable resource for research focusing on public health, population health, or social determinants of health, to name a few.
PolicyMap includes data from numerous sources, such as the US Census, the Bureau of Labor Statistics, and the CDC. Upload your own data to create maps in combination with PolicyMap data, then download data, figures, or reports for deeper analysis. Use this tool to identify the challenges facing a community and strategically target interventions.
Take a few minutes to explore PolicyMap yourself, or follow along with our introductory tutorial.
For further information or help navigating PolicyMap, contact Kim MacKenzie or Catherine Carr at the Lamar Soutter Library.
